Understanding the normal cardiac output (CO) and cardiac output range is fundamental for interpreting cardiovascular assessments. These values are not static; they vary significantly based on age, gender, body surface area (BSA), activity level, and underlying clinical conditions. This page provides an authoritative reference for normal CO and Cardiac Index (CI) values, supported by (conceptual) interactive charts to illustrate these variations.
Standard Normal Cardiac Output and Cardiac Index in Adults
For a healthy adult at rest:
- Normal Cardiac Output (CO): Approximately 4.0 to 8.0 Liters per minute (L/min).
- Normal Cardiac Index (CI): Approximately 2.5 to 4.0 Liters per minute per square meter (L/min/m2). The Cardiac Index Calculator helps determine CI by normalizing CO to BSA.
These are general ranges. It’s crucial to consider individual factors. More on the basics can be found at What is Cardiac Output?
Variations in Normal Cardiac Output Values
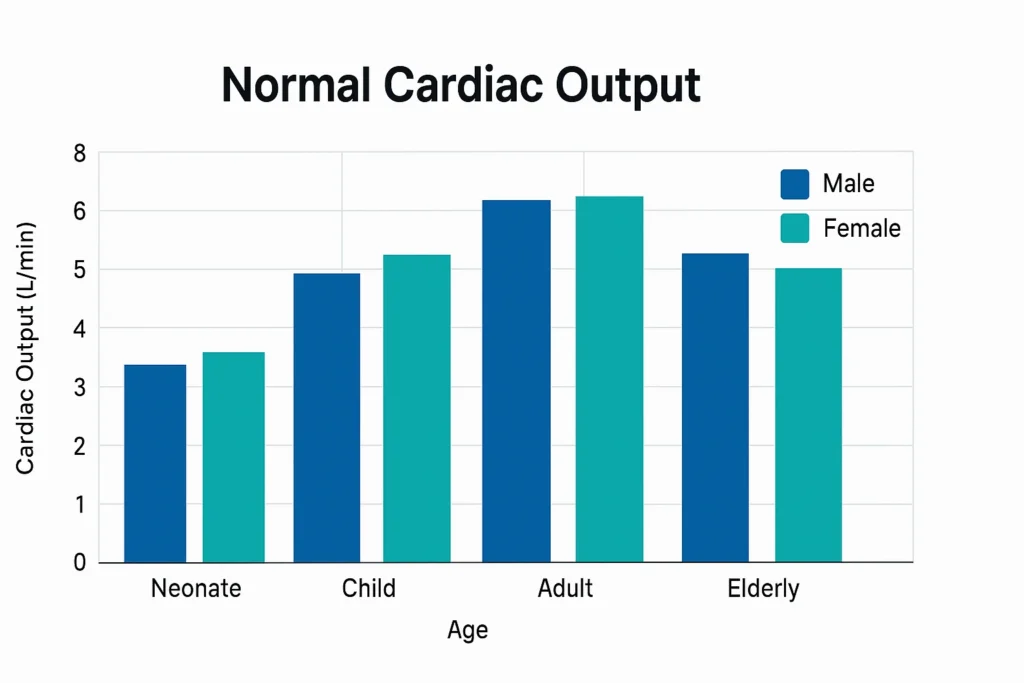
1. By Age
Cardiac output changes significantly throughout life:
- Neonates & Infants: Have a higher CO relative to their body weight (often expressed as mL/kg/min) and a higher CI. For example, a newborn’s CI can be 3.5-6.0 L/min/m2, and CO around 150-250 mL/kg/min. See our Neonatal CO Calculator and Pediatric CO Calculator for more specifics.
- Children: CI gradually trends towards adult values as they grow. HR is higher, SV is smaller.
- Adults: As stated above, CI generally 2.5-4.0 L/min/m2.
- Elderly (e.g., >65-70 years): There might be a slight decline in resting CO and CI with age, or changes in the ability to augment CO during stress. Diastolic dysfunction becomes more prevalent, which can affect SV and thus CO. However, healthy elderly individuals can maintain normal CO. Some studies like those from the National Institute on Aging might offer specific data.
(Conceptual Interactive Chart: A line graph showing Cardiac Index (Y-axis) vs. Age (X-axis) from neonate to elderly, with a shaded normal range.)
2. By Gender
- Generally, adult males tend to have slightly higher absolute cardiac output values than adult females, primarily due to larger average body size and heart size.
- When indexed to BSA (Cardiac Index), these differences between genders become less pronounced, though some studies still show slightly lower CI in females.
3. By Body Surface Area (BSA)
This is precisely why Cardiac Index (CI) is used. Larger individuals naturally have a higher absolute CO to perfuse a larger body mass. CI normalizes for this.
Small Adult (BSA = 1.5 m², CI = 3.0 L/min/m²):
CO = 3.0 × 1.5 = 4.5 L/min
Large Adult (BSA = 2.2 m², CI = 3.0 L/min/m²):
CO = 3.0 × 2.2 = 6.6 L/min
Learn more about the differences between CO and CI.
4. By Activity Level / Physiological Stress
Cardiac output is highly responsive to metabolic demands:
- Rest: Baseline values as stated.
- Exercise: CO can increase dramatically, up to 20-25 L/min in healthy untrained adults, and even 30-40 L/min in elite athletes. This increase is achieved by augmenting both heart rate and stroke volume.
- Stress (e.g., fever, anxiety): Sympathetic stimulation increases HR and contractility, leading to increased CO.
5. By Clinical Conditions
Many medical conditions alter cardiac output. Here are a few examples (for a detailed list, see CO in Medical Conditions):
- Heart Failure: Typically low CO/CI, especially in systolic dysfunction.
- Sepsis: Can be high CO (early “warm” shock) or low CO (late “cold” shock).
- Pregnancy: CO increases by 30-50%.
- Anemia (severe): High CO state.
- Hyperthyroidism: High CO state.
- Hypothyroidism: Low CO state.
- Hypovolemia/Dehydration: Low CO due to decreased preload.
(Conceptual Interactive Chart: Bar chart showing typical CO/CI changes (e.g., increased, decreased, variable) for various clinical conditions compared to a normal baseline.)
Reference Table: Approximate Normal Resting Values
| Parameter | Neonate (Term) | Child (5 yrs) | Adult (Healthy) | Elderly (>70 yrs, Healthy) |
|---|---|---|---|---|
| Heart Rate (bpm) | 120-160 | 80-120 | 60-100 | 60-90 (may be lower if fit) |
| Stroke Volume (mL/beat) | ~5-10 mL (varies greatly with weight) | ~30-50 mL | 60-100 mL | 50-90 mL (may decline slightly) |
| Cardiac Output (L/min) | ~0.6-1.6 L/min (highly weight dependent) | ~2.5-4.5 L/min | 4.0-8.0 L/min | 3.5-7.0 L/min |
| Cardiac Index (L/min/m2) | ~3.0-5.0 (can be higher) | ~2.8-4.2 | 2.5-4.0 | 2.2-3.8 (may decline slightly) |
Disclaimer: These values are approximate and for educational purposes. Clinical decisions should always be based on comprehensive patient assessment and specific, validated nomograms or guidelines from sources like the American Society of Echocardiography or the European Society of Cardiology.
Using our cardiac output calculator tools can help you derive these values, but always interpret them in the context of the patient and these normal ranges. For specific calculations, ensure you are using the appropriate tool, e.g., for children or neonates.